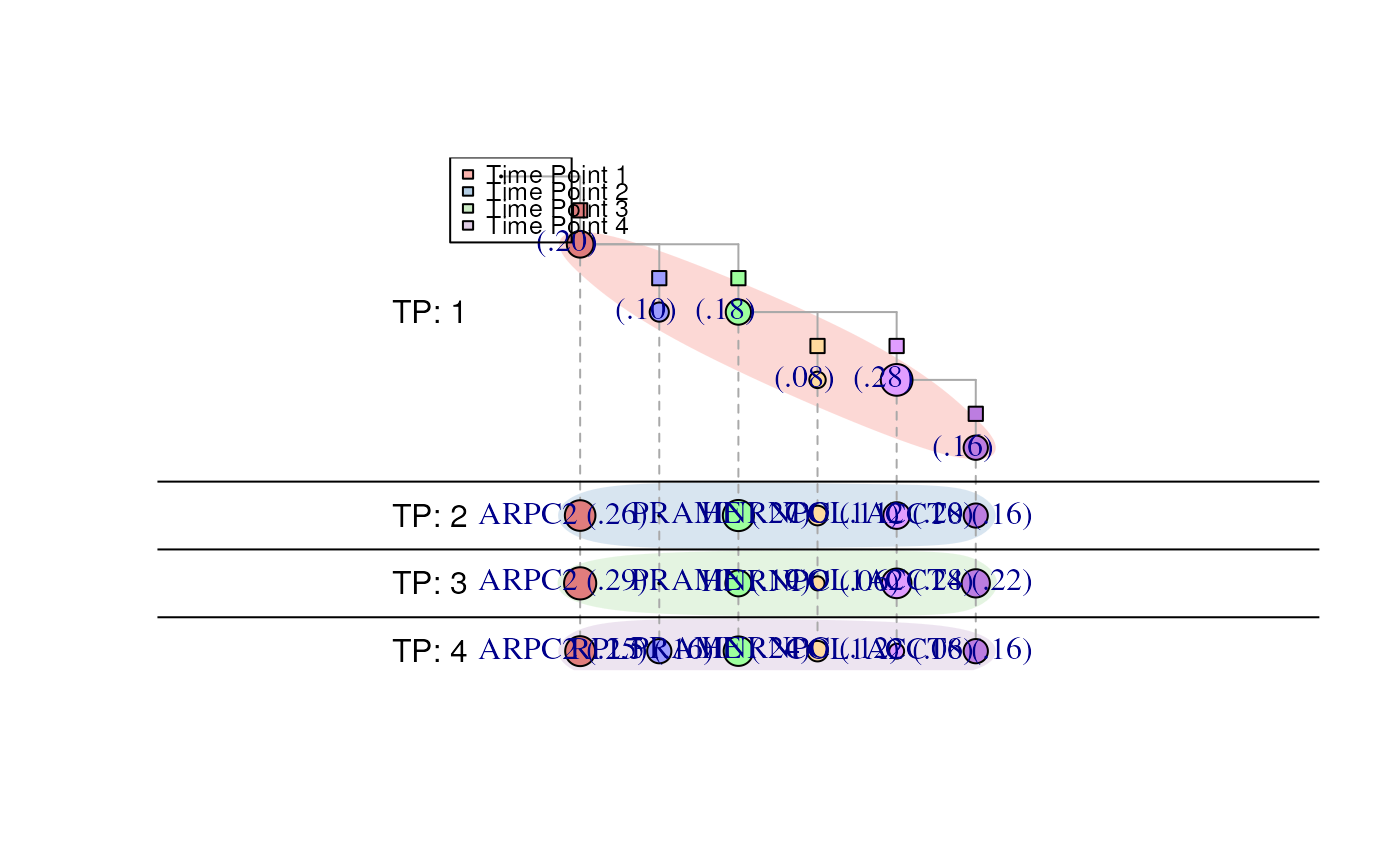
Plot a longitudinal tree inferred by LACE.
longitudinal.tree.plot(
  inference,
  rem_unseen_leafs = TRUE,
  show_plot = TRUE,
  filename = "lg_output.xml",
  labels_show = "mutations",
  clone_labels = NULL,
  show_prev = TRUE,
  label.cex = 1,
  size = 500,
  size2 = NULL,
  tk_plot = FALSE,
  tp_lines = TRUE,
  tp_mark = TRUE,
  tp_mark_alpha = 0.5,
  legend = TRUE,
  legend_position = "topright",
  label_offset = 4,
  legend_cex = 0.8
)
Arguments
- inference
Results of the inference by LACE.
- rem_unseen_leafs
If TRUE (default) remove all the leafs that have never been observed (prevalence = 0 in each time point)
- show_plot
If TRUE (default) output the longitudinal tree to the current graphical device.
- filename
Specify the name of the file where to save the longitudinal tree. Dot or graphml formats are supported and are chosen based on the extenction of the filename (.dot or .xml).
- labels_show
Specify which type of label should be placed on the tree; options are, "mutations": parental edges are labeled with the acquired mutation between the two nodes (genotypes); "clones": nodes (genotypes) are labeled with their last acquired mutation; "both": either nodes and edges are labeled as specified above; "none": no labels will show on the longitudinal tree.
- clone_labels
Character vector that specifies the name of the nodes (genotypes). If it is NULL (default), nodes will be labeled as specified by "label" parameter.
- show_prev
If TRUE (default) add to clones label the correspongind prevalance.
- label.cex
Specify the size of the labels.
- size
Specify size of the nodes. The final area is proportional with the node prevalence.
- size2
Specify the size of the second dimension of the nodes. If NULL (default), it is set equal to "size".
- tk_plot
If TRUE, uses tkplot function from igraph library to plot an interactive tree. Default is FALSE.
- tp_lines
If TRUE (defaul) the function draws lines between timepoints.
- tp_mark
If TRUE (defaul) the function draws different colored area under the nodes in different time points.
- tp_mark_alpha
Specify the alpha value of the area drawed when tp_mark = TRUE.
- legend
If TRUE (default) a legend will be displayed on the plot.
- legend_position
Specify the legend position.
- label_offset
Move the mutation labels horizontally (default = 4)
- legend_cex
Specify size of the legend text.
Value
An igraph object g with the longitudinal tree inferred by LACE.
Examples
data(inference)
clone_labels = c("ARPC2","PRAME","HNRNPC","COL1A2","RPL5","CCT8")
longitudinal.tree.plot(inference = inference,
                       labels = "clones",
                       clone_labels = clone_labels,
                       legend_position = "topleft")
#> Warning: vertex attribute color contains NAs. Replacing with default value 1
#> Warning: vertex attribute color contains NAs. Replacing with default value 1
#> Warning: vertex attribute color contains NAs. Replacing with default value 1
#> Warning: vertex attribute color contains NAs. Replacing with default value 1
#> Warning: vertex attribute color contains NAs. Replacing with default value 1
#> Warning: vertex attribute color contains NAs. Replacing with default value 1
#> Warning: vertex attribute color contains NAs. Replacing with default value 1
#> Warning: vertex attribute color contains NAs. Replacing with default value 1
#> Warning: vertex attribute color contains NAs. Replacing with default value 1
#> Warning: vertex attribute color contains NAs. Replacing with default value 1
#> Warning: vertex attribute color contains NAs. Replacing with default value 1
#> Warning: vertex attribute color contains NAs. Replacing with default value 1
#> Warning: vertex attribute color contains NAs. Replacing with default value 1
#> Warning: vertex attribute color contains NAs. Replacing with default value 1
#> Warning: vertex attribute color contains NAs. Replacing with default value 1
#> Warning: vertex attribute color contains NAs. Replacing with default value 1
#> Warning: vertex attribute color contains NAs. Replacing with default value 1
#> Warning: vertex attribute color contains NAs. Replacing with default value 1
#> Warning: vertex attribute color contains NAs. Replacing with default value 1
#> Warning: vertex attribute color contains NAs. Replacing with default value 1
#> Warning: vertex attribute color contains NAs. Replacing with default value 1
#> Warning: vertex attribute color contains NAs. Replacing with default value 1
#> Warning: vertex attribute color contains NAs. Replacing with default value 1
#> Warning: vertex attribute color contains NAs. Replacing with default value 1
#> Warning: vertex attribute color contains NAs. Replacing with default value 1
#> Warning: vertex attribute color contains NAs. Replacing with default value 1
#> Warning: vertex attribute color contains NAs. Replacing with default value 1
#> Warning: vertex attribute color contains NAs. Replacing with default value 1
#> Warning: vertex attribute color contains NAs. Replacing with default value 1
#> Warning: vertex attribute color contains NAs. Replacing with default value 1
#> Warning: vertex attribute color contains NAs. Replacing with default value 1

#> IGRAPH 4c6bd18 DN-- 25 24 --
#> + attr: name (v/c), branch_level (v/n), branch (v/n), label (v/c),
#> | last_mutation (v/c), TP (v/n), clone (v/n), prevalance (v/n), size
#> | (v/n), size2 (v/n), shape (v/c), label.dist (v/n), label.degree
#> | (v/n), extincion (v/n), color (v/c), coord.x (v/l), coord.y (v/l),
#> | type (e/n), extincion (e/l), label (e/c), name (e/c), lty (e/n)
#> + edges from 4c6bd18 (vertex names):
#> [1] T1-ARPC2_2_218249894_C_T->T2-ARPC2_2_218249894_C_T
#> [2] T2-ARPC2_2_218249894_C_T->T3-ARPC2_2_218249894_C_T
#> [3] T3-ARPC2_2_218249894_C_T->T4-ARPC2_2_218249894_C_T
#> [4] T1-PRAME_22_22551005_T_A->T2-PRAME_22_22551005_T_A
#> + ... omitted several edges